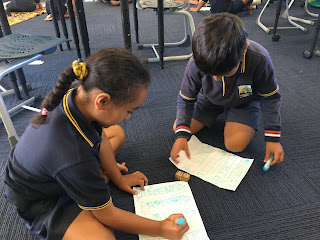
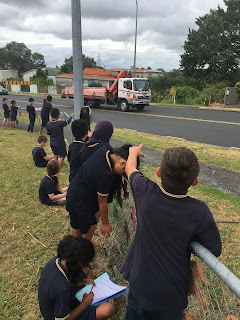
We decided to find some 'real life data' for our statistics investigation during Maths.
We all know Hillsborough Road is very busy before and after school, but maybe not so busy at 12 o'clock - midday.
To collect our data, we thought 15 minutes would be enough time to get a snapshot of the road usage.
To collect the information we worked with a buddy and chose whether to count ....
DIFFERENT COLOURS OF VEHICLES
or
DIFFERENT TYPES OF VEHICLES.
This data was collected in the form of a tally chart which could be totalled.

Back in the classroom we were able look carefully at our findings to make statements and predictions.


